Analysis 26: Sources of Company Share Change
EXHIBITS:

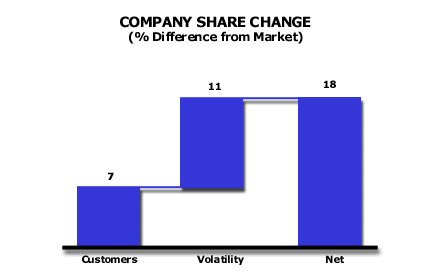
| HOW TO INTERPRET THE ANALYSIS: This company grew 18% faster than the market as a whole. The company gained market share. The company gained market share due both to the growth of its customers as well as to its good performance in Net Volatility. Its customers grew at a rate 7% faster than the market as whole. The company out performed its average competitor on Volatility as well. This company had a Net Positive Volatility that contributed 11% of the total 18% growth rate that the company enjoyed over that of the market.
PURPOSE: This analysis separates company share change into that coming from the share change of its own customers and that resulting from the net effect of volatility on the company. The analysis indicates the strength of the customer mix and provides early warning of a deteriorating value proposition position of the company in the marketplace. APPROACH: This analysis separates the volume gain that the company realizes from its customers and their growth, where the customers do not change suppliers, from that growth that is the result of net volatility, where customers change suppliers. The company served some of the customers in the initial period but it no longer serves these today. Other customers the company did not have in the initial period but the company does serve them today. All of these customers affect the company's growth, but each set contains a different strategic message. A company has 5 sources of share growth: (1) It can grow with its customers, especially if its customers grow faster than the marketplace. It can grow because its net volatility is better than its competition. Net volatility, means the volume the company gains by increasing its penetration of the marketplace ( Positive volatility), less the volume it loses with customers where its penetration falls (Negative volatility). (2) It gains volume by getting into relationships where it was not included previously. This is "Get In" Positive volatility. (3) It also gains volume from Positive volatility when its proportion of its existing customers' volume increases at the expense of one or more competitors. This is "Increase Use" positive volatility. (4) It has a Negative volatility volume loss when customers take the company out of the relationship with them. This is "Get Out" negative volatility. (5) It has a Negative volatility when customers decrease the proportion of the Company's products in their overall relationship. This is "Decrease Use" Negative volatility. In both (4) and (5), Negative volatility becomes a source of share growth when a company loses less volume than does the average competitor in the market. "Stay In" customers do not make any changes in their purchases from suppliers during the period. Net volatility is the Positive volatility, from Get In and Increase Use, less the Negative volatility, from Get Out and Decrease Use. This analysis separates the volume gain that the company realized on Stay In customer volume from the volume gain due to its experience of net volatility. The period might have seen customers new to the market buy from the company. These new market customers provided Positive volatility. Offsetting Positive volatility from customers new to the market is Negative volatility from customers leaving the market. This analysis must be conducted on a customer-by-customer basis. If it is not possible to do this for every customer that the company had in the initial period, as well as for those who joined in the interim period, then the company should sample its customer base to conduct this analysis. The customer growth part of the volume increase comes primarily from those customers who did not change suppliers during the period under study. The net volatility figure for the company is the result of all customer changes in suppliers, involving the company, where there was a Get In/Increase Use or Get Out/Decrease Use event. The net volume change caused by those volatility events make up volatility volume change. The company's total volume change is the sum of customer growth, where customers did not change suppliers, plus the net volatility change in volume. This analysis is most effective when it is conducted using the overall market performance as the base. If the company does not have the overall market performance, it can take a first cut at this analysis by analyzing, as described above, its total volume change during the period and breaking that volume into customer growth and net volatility change. For more detail on the calculations needed for this analysis, see
Company Share Change: Industry Examples » Return to Diagnose Segments: Company Share Change and Volatility |
|
Recommended Reading |
| For a greater overall perspective on this subject, we recommend the following related items:
Analyses:
Symptoms and Implications: Symptoms developing in the market that would suggest the need for this analysis.
Perspectives: Conclusions we have reached as a result of our long-term study and observations.
|
