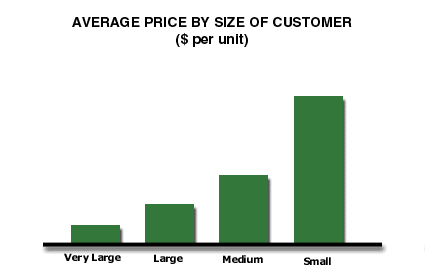
Analysis 8: Average Price Paid by Size of Customer
EXHIBITS:

| HOW TO INTERPRET THE ANALYSIS: This exhibit is shown without numbers. It shows that the Very Large customers pay the lowest prices in the marketplace and that the average prices paid by the various size customer segments increase as the size of the customer declines. As an illustration, if the Very Large customers paid $1 per unit, the Large customers might pay $1.05 per unit, the Medium customers might pay $1.12 per unit and small customers might pay $1.20 per unit.
PURPOSE: The analysis helps the company determine the customer size mix it must achieve in order to have a good balance of growth and profitability. In this analysis, the company projects likely prices by customer size segment in order to project probable returns. Alternative analyses might show average gross margins or operating margins by customer size. APPROACH: This analysis must have a single, well-defined product as the basis for the calculation. Usually, the company would use the most common (i.e., Standard Leader) product in the industry. Once the company has defined its product, differences in price realizations by customer take on meaning. The price realizations by customer for this product should be the final "pocket" price received by the company. The price should reflect discounts, rebates and price reduction programs of all kinds, whether done on a per-transaction, per-quarter or per-year basis. To complete this analysis, the company divides the total revenues received from the customer segment by the total units sold to that segment during a discrete recent period of time. If the company measures profitability by customer, it can use that data to replace this analysis, since the major purpose of this analysis is to estimate expected profitability by customer size. If the company has developed its own customer profitability analysis, then the company should modify this analysis to show the average operating profit by customer size. This is a more sophisticated analysis than the one shown. Test Your Knowledge: Size of Customer >> Return to Diagnose Costs: Increasing Margins by Improving Customer Mix |
|
Recommended Reading |
| For a greater overall perspective on this subject, we recommend the following related items:
Analyses: Symptoms and Implications: Symptoms developing in the market that would suggest the need for this analysis.
Perspectives: Conclusions we have reached as a result of our long-term study and observations.
|
